The U.S. economy navigated a volatile second quarter marked by global tensions, elevated inflation pressures, and a moderating labor market. While economic activity remained positive, growth continued at a restrained pace as households and businesses adjusted to higher prices, trade uncertainty, and the economic effects of the military conflict involving Iran. Preliminary estimates suggest that real (inflation-adjusted) Gross Domestic Product (GDP) expanded at an annualized rate of approximately 1.7% during the second quarter, reflecting a slowing from the first quarter but steady growth nonetheless.
Labor market conditions softened further during the quarter, although widespread deterioration was avoided. Nonfarm payroll employment increased by 57,000 jobs in June, substantially below expectations and indicative of slower hiring activity across many sectors. The unemployment rate edged down to 4.2%. Long-term unemployment, those actively seeking employment for more than 26 weeks, continued to trend higher, reinforcing evidence that labor market rebalancing remains underway. Much of the unemployment rate decline, however, reflected lower labor force participation, which fell to 61.5%, its lowest level since the 1970s (outside of the COVID-19 pandemic period). This reflects the ongoing demographic shifts taking place in the United States, most notably the retirement of the Baby Boomer generation. Average hourly earnings increased 3.5% year-over-year, suggesting that wages remained strong, but not highly inflationary.
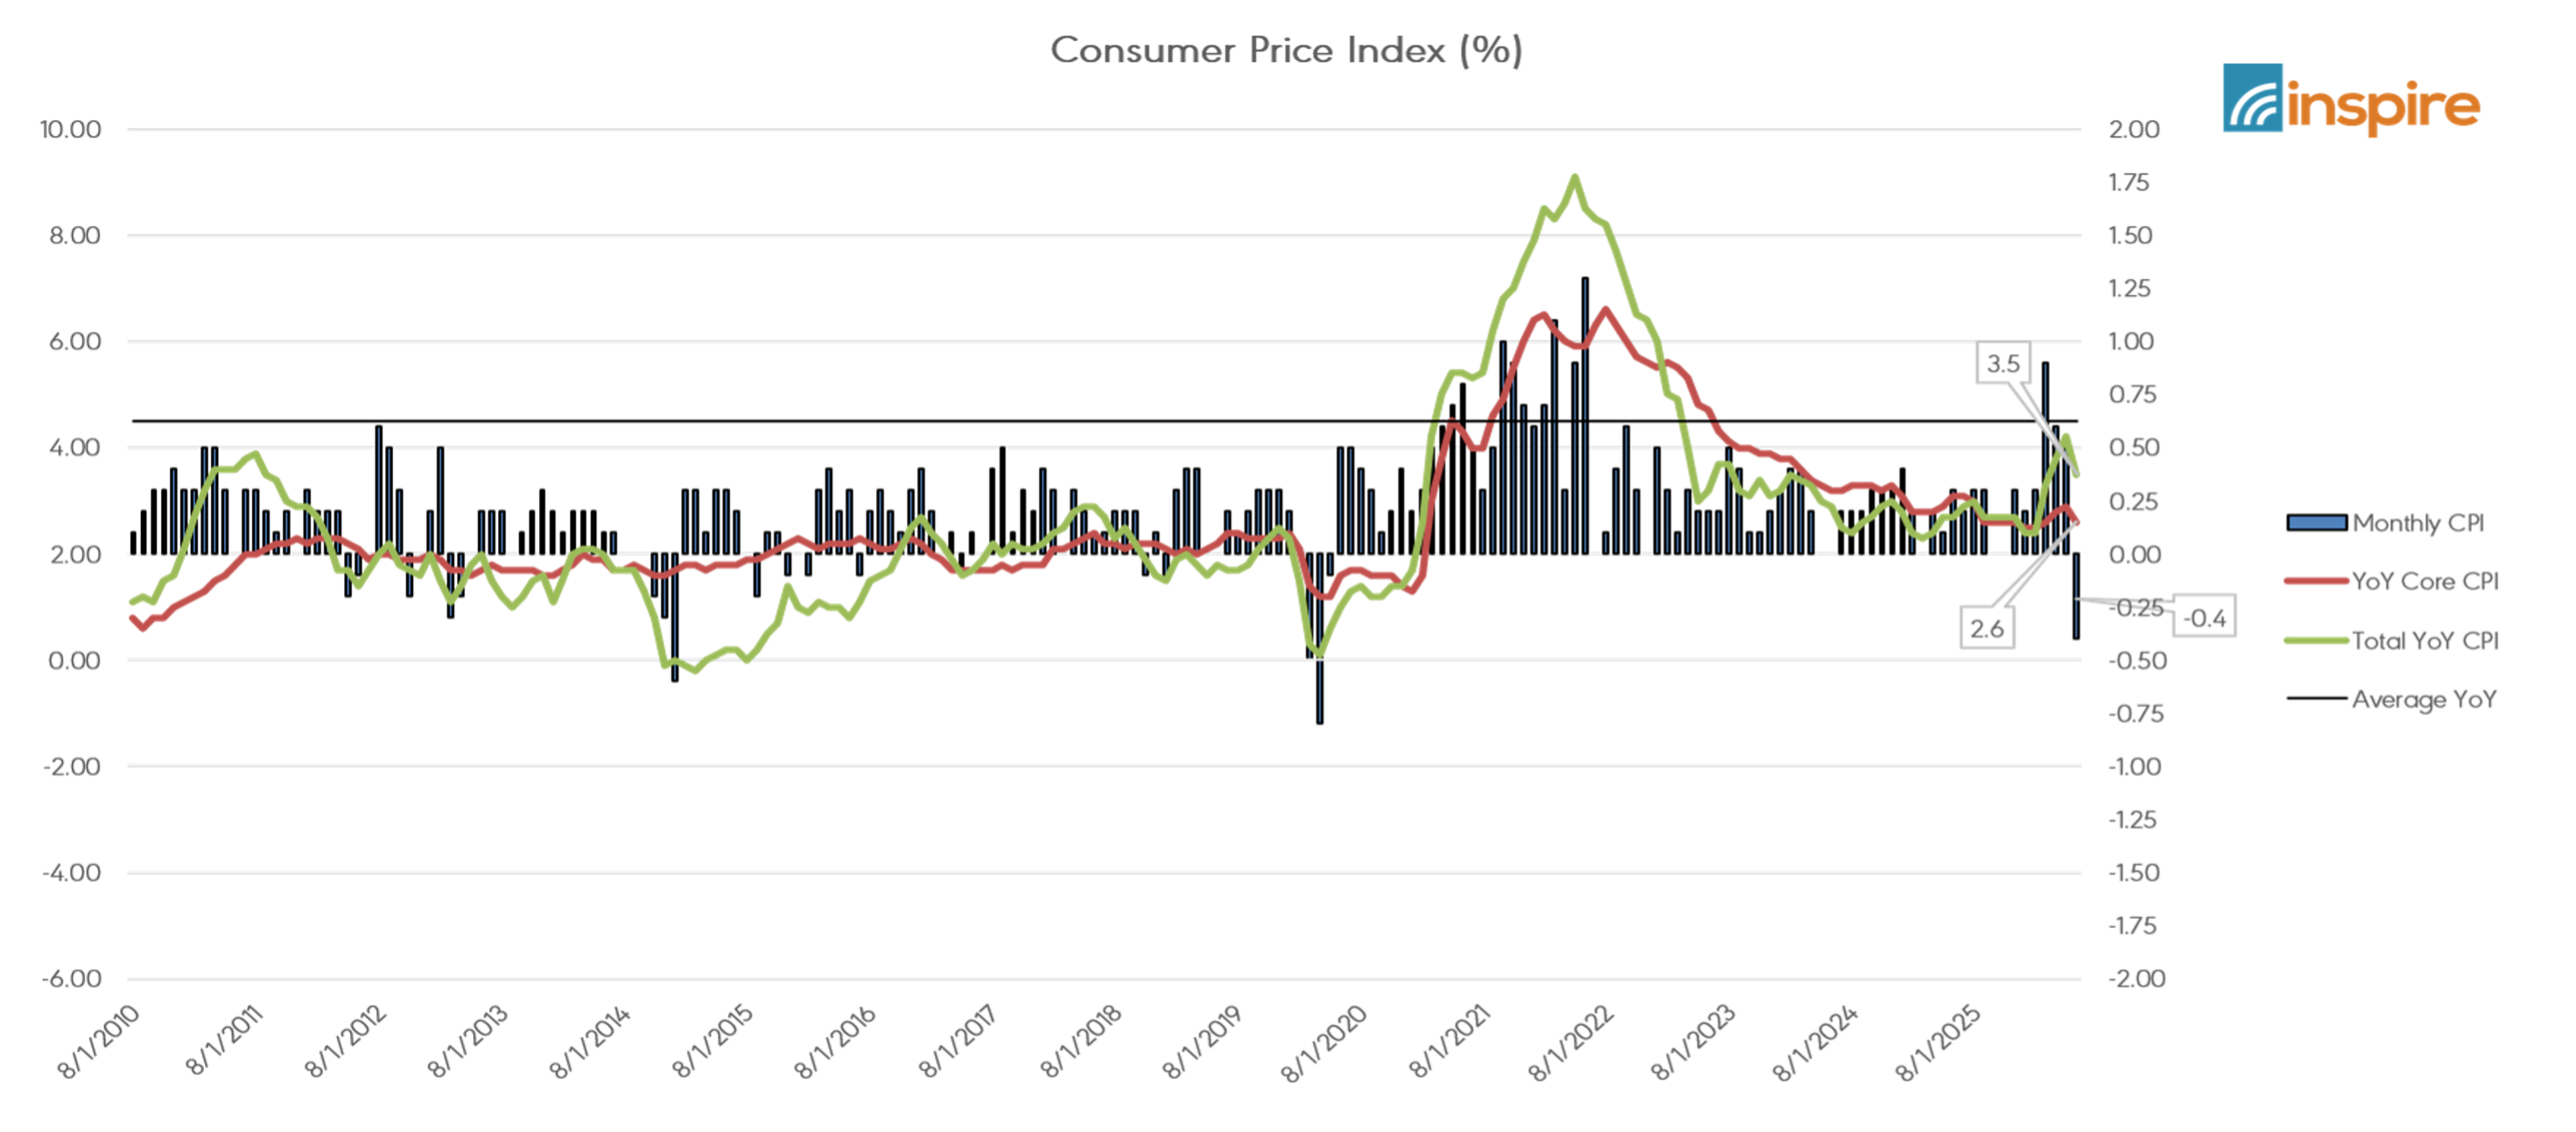
Inflation remained a central concern throughout the quarter. Rising energy costs associated with heightened military conflict in the Middle East pushed consumer prices higher through much of the spring. The Consumer Price Index reached 4.2% year-over-year in May before easing to 3.5% in June as oil prices moderated following temporary reductions in the Iran conflict tensions. Although inflation showed improvement by quarter-end, price growth still remains well above the Federal Reserve’s 2% objective. Consequently, the Federal Open Market Committee, under its new chair, Kevin Warsh, maintained its target federal funds rate at 3.50%-3.75% during its June meeting while emphasizing a cautious, data-dependent approach. Updated Federal Reserve projections reflected expectations for stronger inflation and continued economic uncertainty through the remainder of the year.
Consumer confidence remained subdued throughout the quarter. The Conference Board Consumer Confidence Index increased modestly to 91.2 in June, supported by easing gasoline prices and a temporary ceasefire between the United States and Iran. However, the expectations component remained at 74.4, significantly below the threshold typically associated with economic expansion. Consumers continued to express concerns regarding inflation, employment prospects, geopolitical instability, political acrimony, and future interest rates. As a result, household sentiment remained cautious despite actual economic data that remains healthy.
Global economic conditions remained uneven and highly dependent on global conflict developments. The most significant event during the quarter was the escalation of military conflict in the Middle East, which generated disruptions in energy markets and renewed concerns regarding global supply chains. The International Monetary Fund’s April 2026 World Economic Outlook projected global growth of approximately 3.1% for 2026, noting that the war in the Middle East has become a meaningful headwind to both growth and disinflation. At the same time, continued investment in artificial intelligence, technology infrastructure, and digital transformation provided an important source of support for economic activity in the United States and several Asian economies. The question being as to whether or not these significant capital expenditures will realize the lofty projected returns that are expected.
Looking ahead to the remainder of 2026, the U.S. economy faces a challenging balance between moderating growth and persistent inflationary pressures. The Federal Reserve is expected to proceed cautiously as it evaluates whether recent inflation improvements prove durable. Ongoing global conflict risks, labor market cooling, elevated public debt levels, political disagreements, and uncertainty surrounding global trade conditions remain important downside risks. Nevertheless, continued business investment, particularly in technology and artificial intelligence, may help support growth. Under these conditions, investors should remain attentive to evolving economic data, maintain diversification across asset classes and regions, and stay disciplined amid what is likely to remain an environment of elevated economic and market volatility.

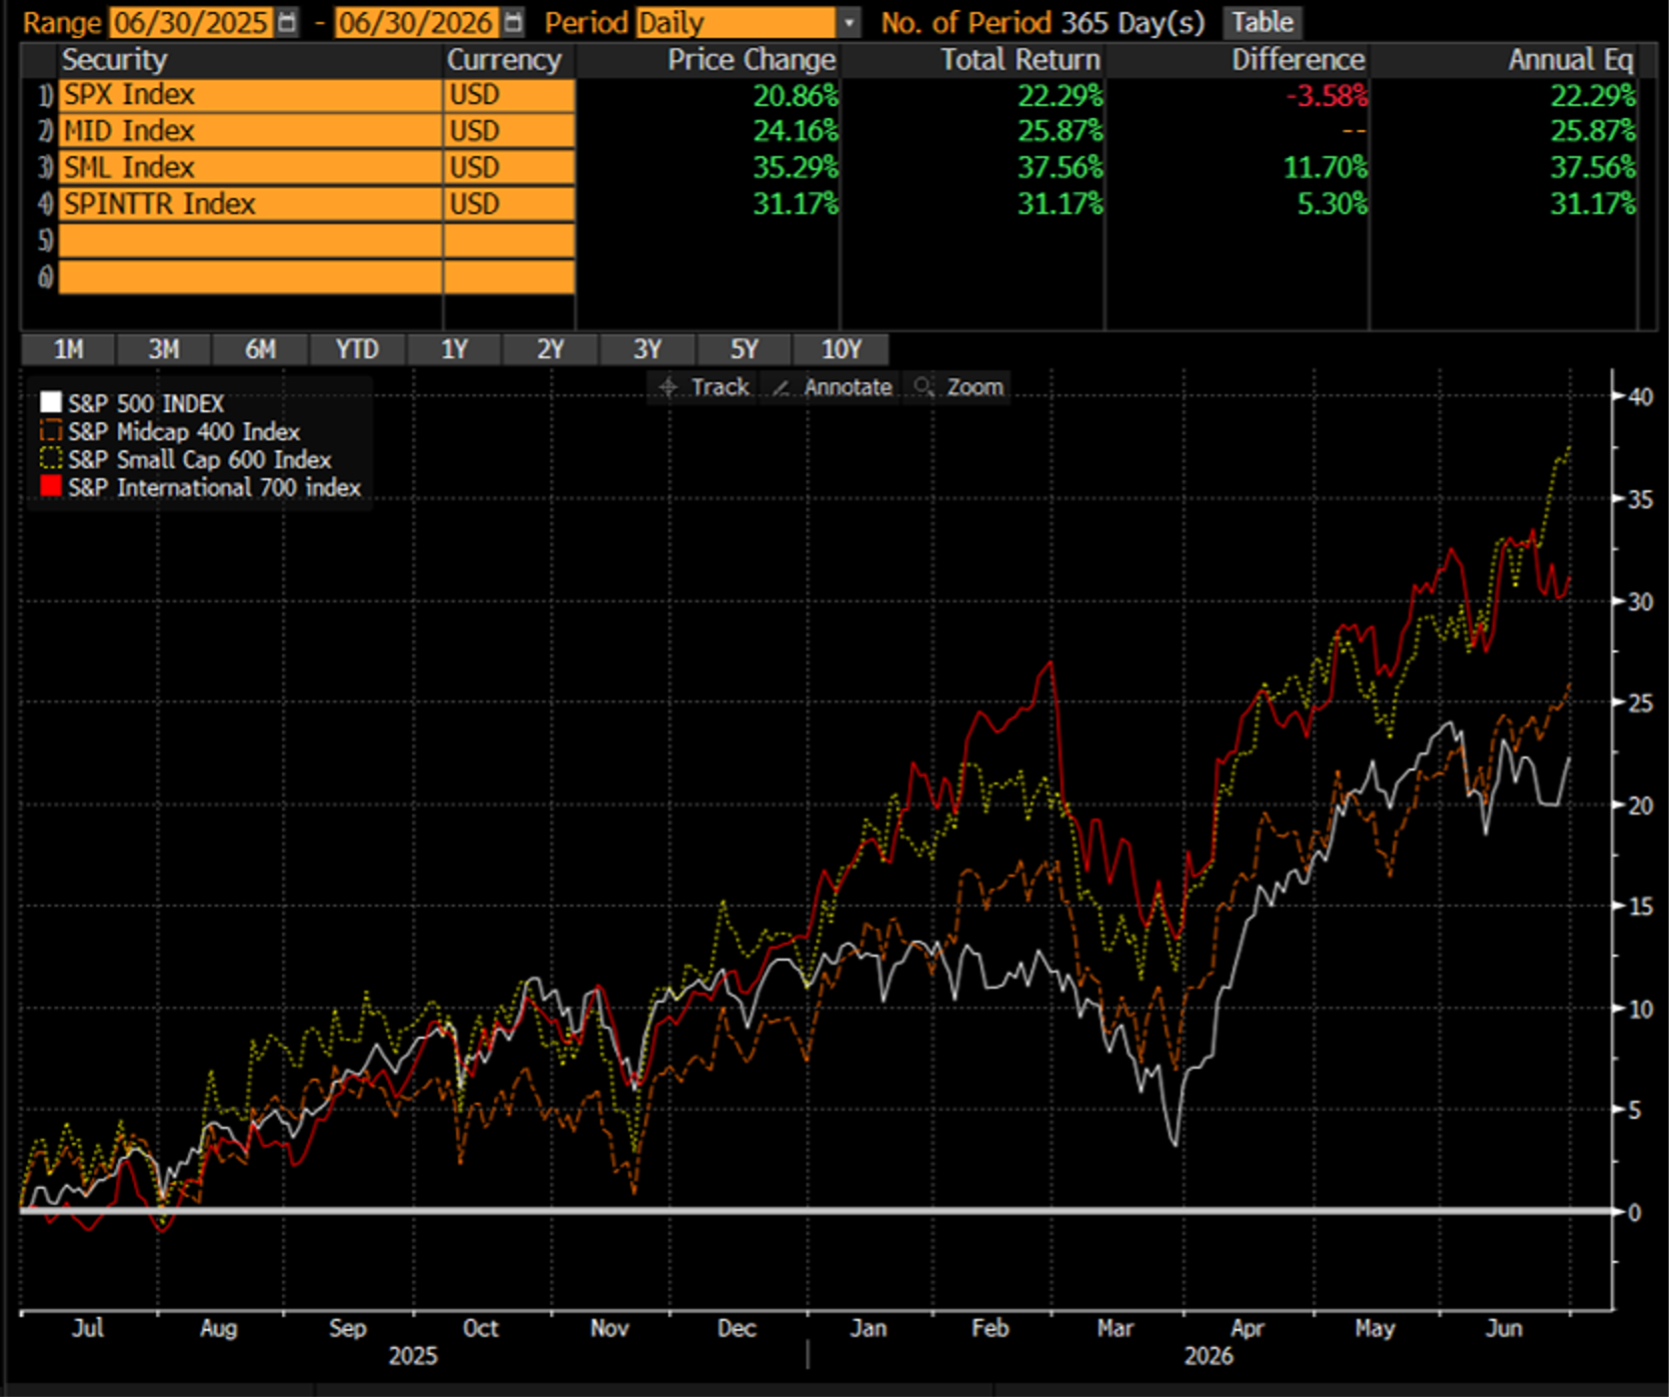
The second quarter started with markets attempting to stabilize after the volatility created late in the first quarter, and that momentum improved as the quarter progressed, when it appeared the immediate worst-case concerns surrounding the Iran conflict and energy market disruption were beginning to ease. U.S. and global equity markets found support during the quarter, with the broader market participation remaining strong as small-cap, mid-cap, large-cap, and international stocks all finished the quarter with positive returns. The S&P 600 Small Cap Index, the S&P 400 Mid Cap Index, the S&P 500 Index, and the S&P International 700 Index all ended the quarter with positive returns of 19.69%, 14.47%, 15.20%, and 15.09%, respectively.

Over the past 12 months, the stock market witnessed a generally positive trajectory across all the major equity indexes, despite periods of volatility tied to inflation concerns, shifting expectations for interest-rate cuts, and geopolitical uncertainty surrounding the Iran conflict. The small-cap market represented by the S&P 600 Small Cap Index had the strongest performance over the past year, with a total return of 37.56%. The S&P 400 Mid Cap Index also experienced strong growth during this period, turning in a one-year return of 25.87% on a total return basis. The S&P 500 Index and the S&P International 700 Index also enjoyed overall gains in the past year of 22.29% and 31.17%, respectively. Overall, the past 12 months exhibited positive market sentiment even in the face of continued headwinds from inflation numbers not falling as fast as the markets had previously hoped, interest rates not falling as much as most analysts had predicted, and ongoing uncertainty around the economic and market impact of the Iran war. Although we are still in the early innings of the current bull market, we could easily see a correction in the next few months as investors digest the strong gains from the past year and assess the longer-term effects of higher energy prices, Fed policy, and global instability. Even with this warning in mind, we recommend investors remain invested and stay focused on the long-term opportunities in a well-diversified global portfolio, as the probability of positive returns over the next 12 to 24 months remains favorable.
Inflation came in at 0.60% (month-over-month) in April, meeting expectations, which fell from the peak in March of 0.90%. The numbers also came out in line with expectations for May at 0.50%, and the expectation for inflation to fall in June beat the expectation by falling -0.40%. As of the end of the first quarter, the headline Inflation number fell from 4.2% at the end of May to 3.5% at the end of June. We will likely see month-over-month numbers come back down in the next few months if the conflict with Iran escalates and the Strait of Hormuz is reopened. Core inflation, which strips out volatile food and energy, ended the quarter at 2.6%.
The initial GDP report for the first quarter was expected to come in at 2.2% but fell short, at 2.0%, when it was released in April. When the “second” release came out in May, GDP growth came in even lower than the expectation of 2.0%, at only 1.6% for the first quarter. The forecast was revised to 1.7% for the third release but surprised on the upside when it was published on June 25th at 2.1%. The debate among economists and market pundits during the past quarter has been focused on whether the Iran war and the higher inflation numbers would cause a recession. For now, the economic outlook remains uncertain.
The yield curve is no longer inverted, but there is now fear of a recession driven by a slowing labor market, slower consumer spending, and uncertainty over the economic effects of the war in Iran and the rise in oil prices on U.S. consumers.

The unemployment rate remained steady at 4.3% in April and May, due to a resilient economy in the face of the uncertainty of the ramifications of the Iran war. A surprise number came in June when the unemployment rate fell to 4.2%, when the expectation was for it to remain at 4.3%. Although we are still above the 4% level, it’s possible we could see the unemployment rate begin a downward path if the economy remains resilient in the second half of 2026.
Nonfarm Payrolls had a sporadic showing during the past three months, with April coming in at 115k jobs, which was above the estimate of 67k. Then, in May, 172k jobs were created when only 86k new jobs were expected. The new job numbers reversed course in June, with new job expectations of 113k, but we actually only saw jobs grow by 57k.
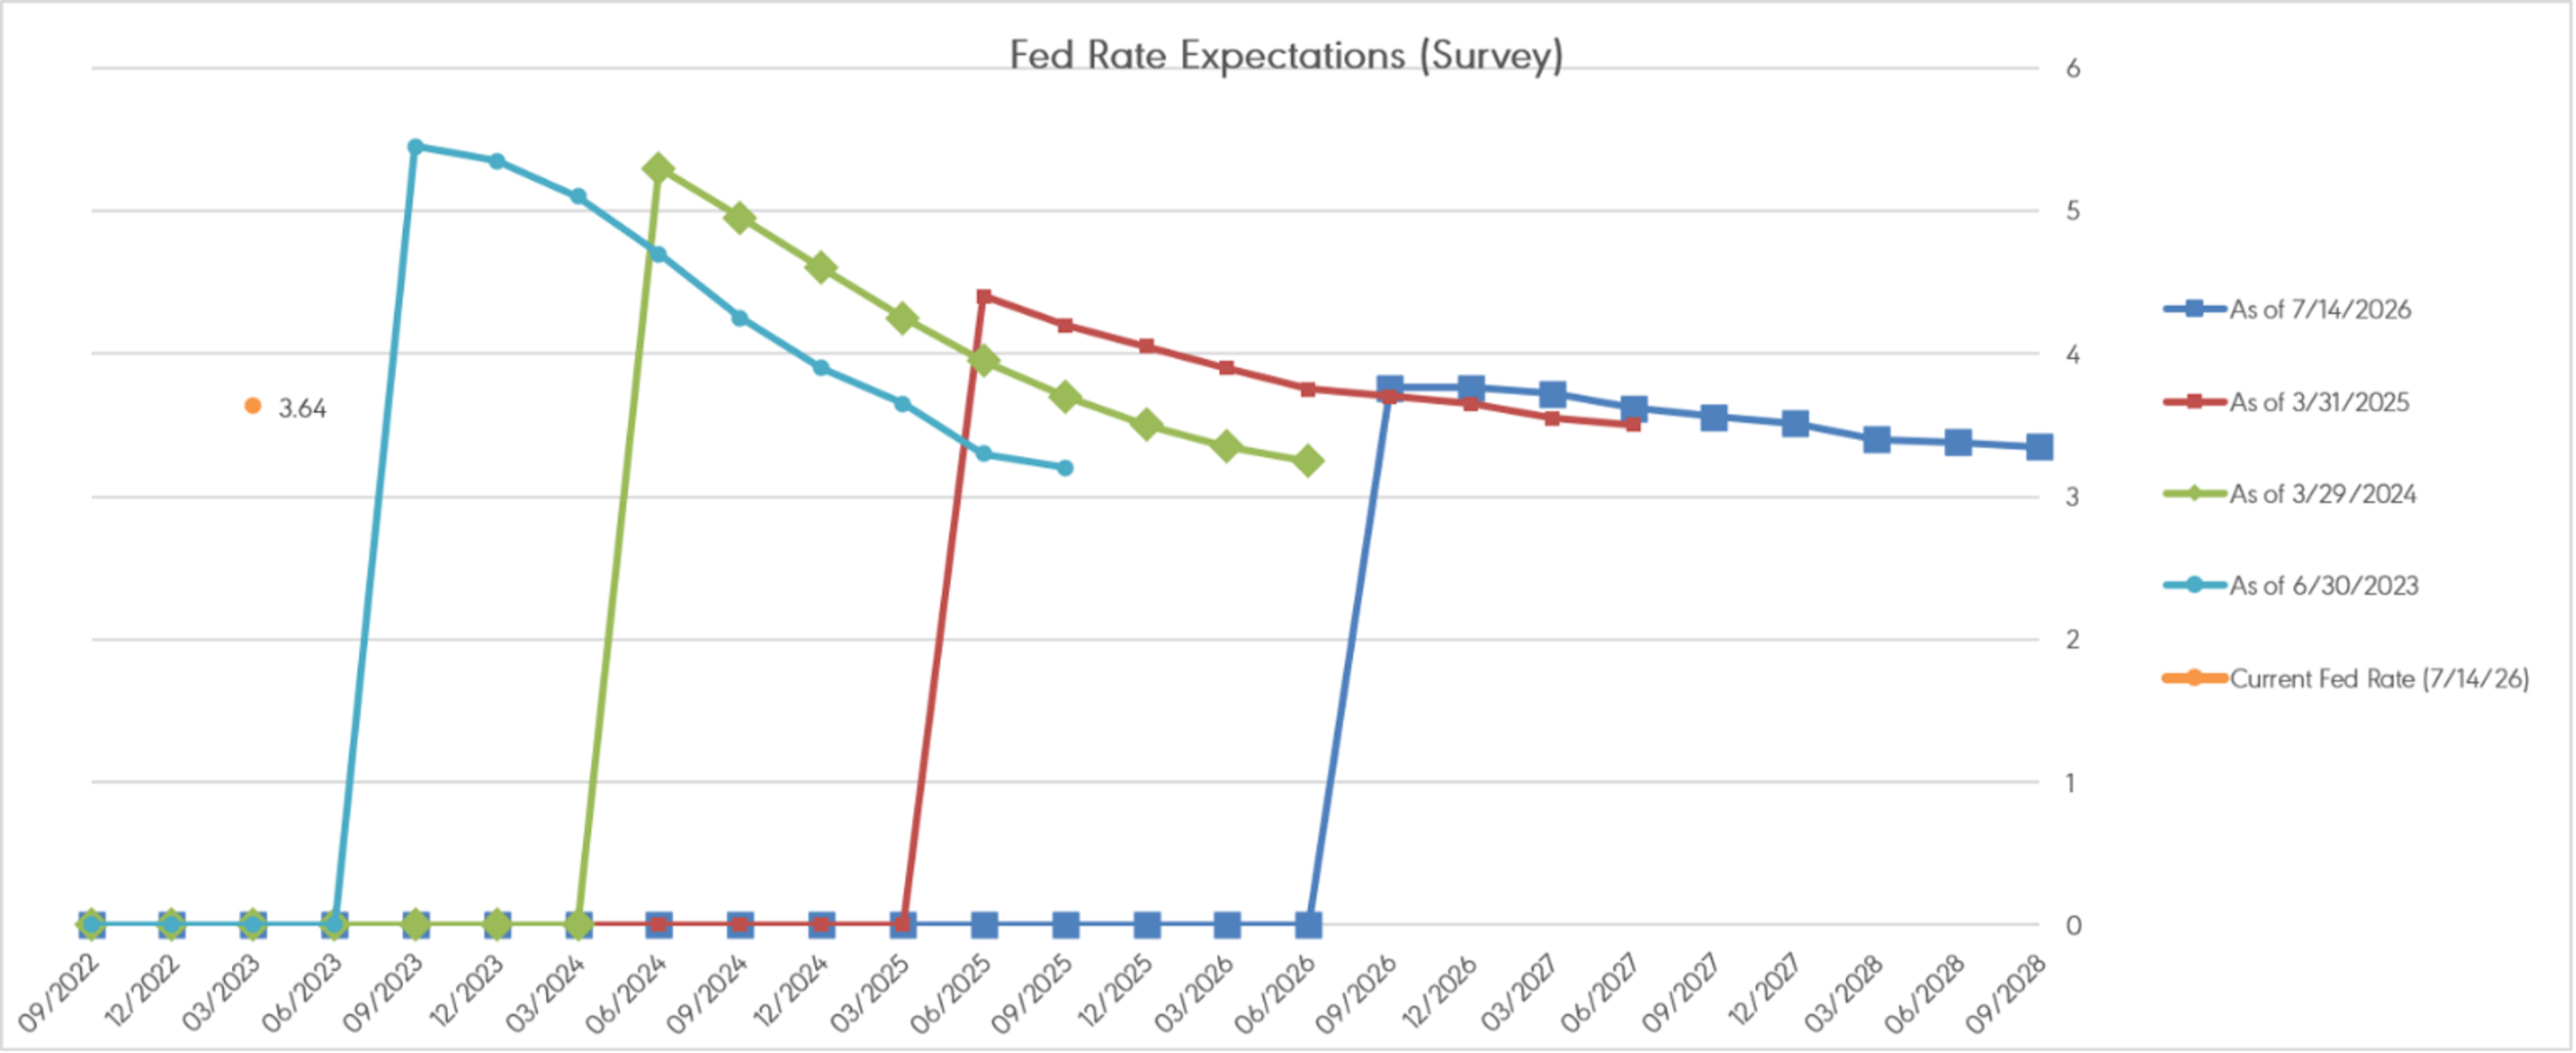
The Federal Open Market Committee continued down the path of sitting on its hands by keeping the Federal Funds Rate “unchanged” during the most recent meetings in April and June. One was Powell’s last meeting as Chairman, and the most recent was the first with Kevin Warsh as the new Chairman. Based on the recent comments of the new Chairman, we should not be surprised if the pause in rate cuts will remain the plan for the remainder of the year, and there was even a hint that the next move could be a rate increase, with the fear of inflation still on the horizon. The current expectation is for the federal funds rate to gradually decline toward the 3.25% range. While a cooling labor market would typically justify rate cuts, concerns about inflation remain. Instead of an aggressive easing policy, the Fed has been extremely slow in its moves, waiting for clearer data on both inflation and broader economic conditions.
Inspire Investing, LLC serves as the investment adviser to certain proprietary ETFs used in Inspire portfolios. Inspire receives management fees from these ETFs, creating a potential conflict of interest. Inspire seeks to mitigate this conflict through policies and procedures that ensure recommendations are made in clients' best interests and consistent with their unique goals and risk profiles. Additional details can be found in Inspire's Form ADV Part 2A. Past performance is not indicative of future results. All performance figures referenced herein are historical and may not reflect current or future market conditions. Actual investor outcomes may vary. There is no assurance that any investment strategy will achieve its objectives or avoid losses.
Inspire Investing, LLC serves as the investment adviser to certain proprietary ETFs used in Inspire portfolios. Inspire receives management fees from these ETFs, creating a potential conflict of interest. Inspire seeks to mitigate this conflict through policies and procedures that ensure recommendations are made in clients' best interests and consistent with their unique goals and risk profiles. Additional details can be found in Inspire's Form ADV Part 2A. Past performance is not indicative of future results. All performance figures referenced herein are historical and may not reflect current or future market conditions. Actual investor outcomes may vary. There is no assurance that any investment strategy will achieve its objectives or avoid losses.
Inspire Investing, LLC serves as the investment adviser to certain proprietary ETFs used in Inspire portfolios. Inspire receives management fees from these ETFs, creating a potential conflict of interest. Inspire seeks to mitigate this conflict through policies and procedures that ensure recommendations are made in clients' best interests and consistent with their unique goals and risk profiles. Additional details can be found in Inspire's Form ADV Part 2A. Past performance is not indicative of future results. All performance figures referenced herein are historical and may not reflect current or future market conditions. Actual investor outcomes may vary. There is no assurance that any investment strategy will achieve its objectives or avoid losses.
Inspire Investing, LLC serves as the investment adviser to certain proprietary ETFs used in Inspire portfolios. Inspire receives management fees from these ETFs, creating a potential conflict of interest. Inspire seeks to mitigate this conflict through policies and procedures that ensure recommendations are made in clients' best interests and consistent with their unique goals and risk profiles. Additional details can be found in Inspire's Form ADV Part 2A. Past performance is not indicative of future results. All performance figures referenced herein are historical and may not reflect current or future market conditions. Actual investor outcomes may vary. There is no assurance that any investment strategy will achieve its objectives or avoid losses.
Inspire Investing, LLC serves as the investment adviser to certain proprietary ETFs used in Inspire portfolios. Inspire receives management fees from these ETFs, creating a potential conflict of interest. Inspire seeks to mitigate this conflict through policies and procedures that ensure recommendations are made in clients' best interests and consistent with their unique goals and risk profiles. Additional details can be found in Inspire's Form ADV Part 2A. Past performance is not indicative of future results. All performance figures referenced herein are historical and may not reflect current or future market conditions. Actual investor outcomes may vary. There is no assurance that any investment strategy will achieve its objectives or avoid losses.
Inspire Investing, LLC serves as the investment adviser to certain proprietary ETFs used in Inspire portfolios. Inspire receives management fees from these ETFs, creating a potential conflict of interest. Inspire seeks to mitigate this conflict through policies and procedures that ensure recommendations are made in clients' best interests and consistent with their unique goals and risk profiles. Additional details can be found in Inspire's Form ADV Part 2A. Past performance is not indicative of future results. All performance figures referenced herein are historical and may not reflect current or future market conditions. Actual investor outcomes may vary. There is no assurance that any investment strategy will achieve its objectives or avoid losses.
The Inspire Tactical Balanced ETF (NYSE: RISN) returned 7.41% for the quarter, bringing its annualized performance to 7.17% since inception on July 15, 2020. RISN outperformed its benchmark this quarter—the S&P Target Risk Moderate TR Index posted a 6.03% return.
RISN maintained an 80% equity allocation throughout the quarter. Our equity strategy targets U.S. companies that score highly on the Inspire Impact Score, biblically aligned businesses that are primarily mid- to large-cap with strong fundamentals: consistent revenue and profit growth, low debt, and attractive valuations.
The remaining 20% sits in short-term U.S. government bonds, providing a defensive buffer. We removed the floating rate component last quarter in anticipation of potential rate cuts, but unfortunately, they have not materialized.
We're also watching gold. Current prices have fallen dramatically from the peak in March, but we are still evaluating an appropriate and compelling entry point for this sleeve.
Our allocation remains 80% equities/20% fixed income, but we're actively evaluating a shift back to 70/30 if markets become overpriced. Our long-term objective is unchanged: preserve principal, grow capital over time, and stay aligned with biblical values.
Inspire Investing, LLC serves as the investment adviser to certain proprietary ETFs used in Inspire portfolios. Inspire receives management fees from these ETFs, creating a potential conflict of interest. Inspire seeks to mitigate this conflict through policies and procedures that ensure recommendations are made in clients' best interests and consistent with their unique goals and risk profiles. Additional details can be found in Inspire's Form ADV Part 2A. Past performance is not indicative of future results. All performance figures referenced herein are historical and may not reflect current or future market conditions. Actual investor outcomes may vary. There is no assurance that any investment strategy will achieve its objectives or avoid losses.
Inspire Investing, LLC serves as the investment adviser to certain proprietary ETFs used in Inspire portfolios. Inspire receives management fees from these ETFs, creating a potential conflict of interest. Inspire seeks to mitigate this conflict through policies and procedures that ensure recommendations are made in clients' best interests and consistent with their unique goals and risk profiles. Additional details can be found in Inspire's Form ADV Part 2A. Past performance is not indicative of future results. All performance figures referenced herein are historical and may not reflect current or future market conditions. Actual investor outcomes may vary. There is no assurance that any investment strategy will achieve its objectives or avoid losses.
Certain statements may include forward-looking information based on current beliefs, expectations, and assumptions. These statements are not guarantees of future performance and involve known and unknown risks, uncertainties, and other factors that may cause actual results to differ materially. Inspire undertakes no obligation to update or revise any forward-looking statements.
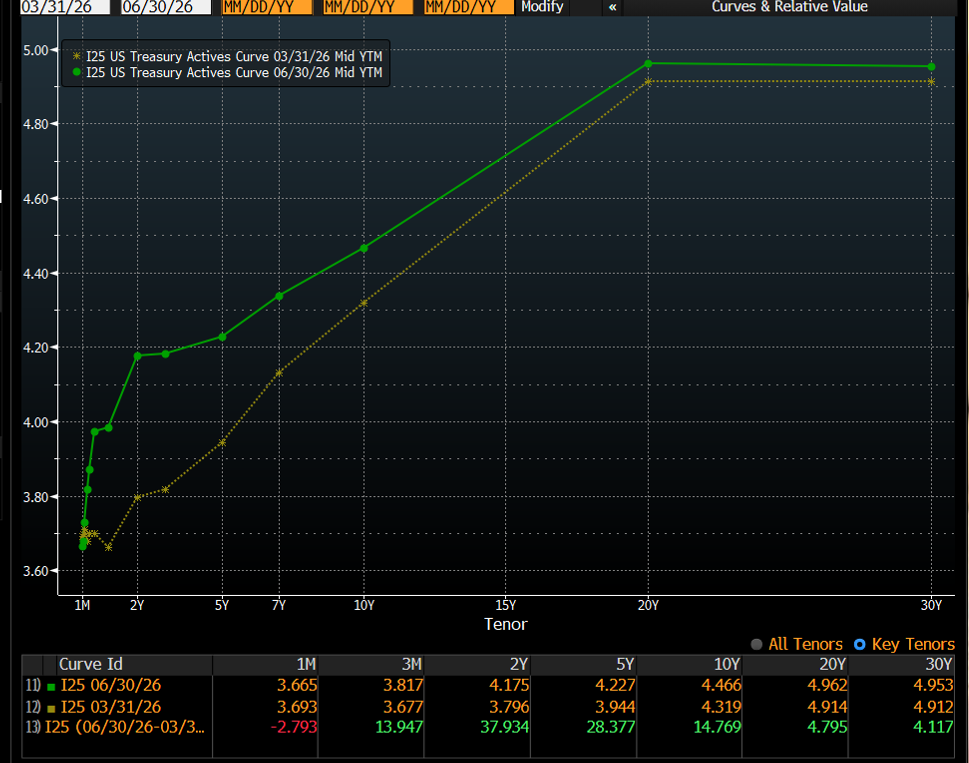
Yields rose across the curve following the FOMC’s decision to keep the Federal Funds Target Range unchanged at its most recent meeting, as markets reassessed the path of future rate cuts amid rising inflation concerns and slower growth risks tied to the Iran war and disruption of oil traffic through the Strait of Hormuz.
As of the end of the second quarter, the 3-month T-Bill yield rose 14 bps from 3.677% to 3.817% vs the 10-year U.S. Treasury, which rose by almost 15 bps from 4.319% to 4.466%.
The 2-year U.S. Treasury yield climbed from 3.796% to 4.175% for an increase of 38 bps as the 5-year yield increased from 3.944% to 4.227% (a rise of over 28 bps) and the 30-year Treasury yield rose from 4.912% to finish the quarter at 4.953% (an increase of almost 4 bps).
The probability of a recession has increased slightly since last quarter, as the economy has slowed down and the same geopolitical issue that dominated every economic conversation on the street and on the business networks at the end of the first quarter is still front and center this quarter - IRAN. Even though the employment numbers show some weakening, a recession may be avoidable if this war with Iran is resolved soon and shipping traffic out of the Persian Gulf returns to normal.
Inspire Investing, LLC serves as the investment adviser to certain proprietary ETFs used in Inspire portfolios. Inspire receives management fees from these ETFs, creating a potential conflict of interest. Inspire seeks to mitigate this conflict through policies and procedures that ensure recommendations are made in clients' best interests and consistent with their unique goals and risk profiles. Additional details can be found in Inspire's Form ADV Part 2A. Past performance is not indicative of future results. All performance figures referenced herein are historical and may not reflect current or future market conditions. Actual investor outcomes may vary. There is no assurance that any investment strategy will achieve its objectives or avoid losses.
The Fed continued to pause its process of lowering interest rates through the second quarter, leaving rates unchanged at the April and June FOMC meetings as policymakers remained focused on the risk that inflation could stay above target longer than expected. The June CPI report brought some temporary relief, with headline inflation falling to 3.5% year-over-year after hitting 4.2% in May, while core inflation declined to 2.6% as lower gasoline and energy prices helped offset the earlier inflation spike tied to the Iran war. However, with energy markets still vulnerable to renewed hostilities in the Strait of Hormuz and the Fed’s own June projections showing a higher expected path for inflation and the federal funds rate, we do not expect the FOMC to move quickly toward rate cuts in Q3. Chairman Warsh has already signaled that the Fed will remain cautious, and if inflation reaccelerates because of higher oil prices or renewed supply-chain disruptions, the market may need to adjust to the possibility that the next policy move is not a cut, but an extended pause or even a hike.
The yield curve is no longer inverted, but it moved higher across most maturities during the second quarter as investors digested the lack of rate cuts, persistent inflation pressure, and the economic uncertainty created by the Iran conflict and higher energy prices. GDP growth improved from the very weak final fourth-quarter reading of 0.5%, with the third estimate of first-quarter GDP coming in at 2.1%, but we are still watching closely to see whether the second-quarter numbers confirm that the economy remains resilient or begins to show more meaningful slowing. Employment has remained mixed, with the unemployment rate falling to 4.2% in June even as nonfarm payrolls slowed to only 57k new jobs versus expectations of 113k. Consumer sentiment has also improved from the record-low May reading, with the University of Michigan Consumer Sentiment Index rising to 49.5 in June from 44.8 in May as gasoline prices moderated, but it remains well below historical norms and nearly 20% lower than a year ago. The combination of modest GDP growth, a still-fragile consumer, a cooling but not collapsing labor market, and a higher yield curve suggests that recession risk has increased but is not yet the base case as we enter the third quarter.
The global capital markets continue to face several geopolitical risks as we move through 2026, and the Iran war remains the most important near-term issue because of its direct connection to global energy prices, shipping traffic through the Strait of Hormuz, inflation expectations, and investor confidence. The temporary easing of tensions helped oil and gasoline prices fall in June, but renewed hostilities in recent days remind us that the risk of another spike in energy prices has not gone away. The ongoing Russia-Ukraine war is also still present, with both sides continuing to escalate attacks even as diplomacy remains uncertain, and this conflict continues to influence European security spending, energy markets, and global risk sentiment. We also remain mindful of broader risks from trade tensions, defense spending, supply-chain stress, and the possibility that new issues could emerge quickly in an already fragile geopolitical environment. We believe volatility in stock and bond prices could remain elevated in Q3, especially if the Iran conflict expands, energy markets tighten again, or recession concerns rise. As usual, we will closely monitor global and domestic developments and assess their potential impacts on our investment strategies.
Certain statements may include forward-looking information based on current beliefs, expectations, and assumptions. These statements are not guarantees of future performance and involve known and unknown risks, uncertainties, and other factors that may cause actual results to differ materially. Inspire undertakes no obligation to update or revise any forward-looking statements.
We believe that we are still in the early innings of the bull market and are thankful we experienced good results from our ETFs in the past quarter, even with all of the global instability we see in our world today. The good news is that our God is still on the throne and in control. With the strong market performance over the past year as well as over the past quarter, we would not be surprised to see a correction of -10% or more in the next 3 to 9 months as investors look to take profits or rebalance their portfolios in light of all that is going on in the world. However, we still expect the broader large-cap market, as well as the small and mid-cap markets, to show upside potential in the next 12 to 24 months. We will always face headwinds, but the market almost always ‘climbs a wall of worry’, so we need to remain patient and stay focused on long-term opportunities.
We remain thankful for the provision, protection, and blessings that we receive from our Heavenly Father and are looking expectantly to what God has in store for the remainder of 2026 and beyond.
We are thankful for each of you for bringing Glory and Honor to our Heavenly Father and our Savior Jesus Christ as you serve your clients through Biblically Responsible Investing.
Inspire Investing, LLC serves as the investment adviser to the Inspire ETFs mentioned in this document. As such, Inspire receives management fees from these funds. This creates a conflict of interest as the firm has a financial incentive to promote its proprietary funds. Inspire seeks to mitigate this conflict through disclosure and a fiduciary duty to recommend investments suitable for clients.
Certain statements contained in this document may be forward-looking in nature and based on current expectations, estimates, and projections. Such statements are not guarantees of future performance and involve risks and uncertainties that are difficult to predict. Actual outcomes may differ materially.
This content is provided for educational and informational purposes only and should not be considered personalized investment advice. Inspire does not provide legal, tax, or accounting advice. Please consult your own advisor regarding your specific situation.


Prepared by Darrell W. Jayroe, CFA, CFP®, CKA®
SENIOR PORTFOLIO MANAGER
for financial professional use only - not for use with the general public