Heading into 2026, investor sentiment was overwhelmingly optimistic. Markets were buoyant, economic conditions appeared favorable, and expectations for continued growth were high. However, that optimism was quickly disrupted.
On February 28, 2026, the Iran War began with Operation Epic Fury and the assassination of Iranian Supreme Leader Ali Khamenei. Since then, investor attention has been dominated by uncertainty surrounding the conflict, accompanied by a noticeable rise in market volatility.
Prior to the outbreak of hostilities, the S&P 500 Index stood at 6,878.88. Over the following 30 days, the index declined 7.8%, falling to 6,343.72 by March 30, 2026. Yet, just as quickly as the market fell, it rebounded – recovering to 6,886.24 by April 13. This marked a full recovery within just two weeks of the low and only 44 days after the initial event.¹
This naturally raises an important question: how does this period compare to past geopolitical conflicts?
Interestingly, the recent volatility aligns closely with historical patterns. As noted by LPL Financial, “Even in the face of more serious and prolonged geopolitical events, the stock market has demonstrated remarkable resilience. On average, the S&P 500 experiences a drawdown of approximately 7% and recovers within about 55 days.” Our current experience fits well within these historical averages.

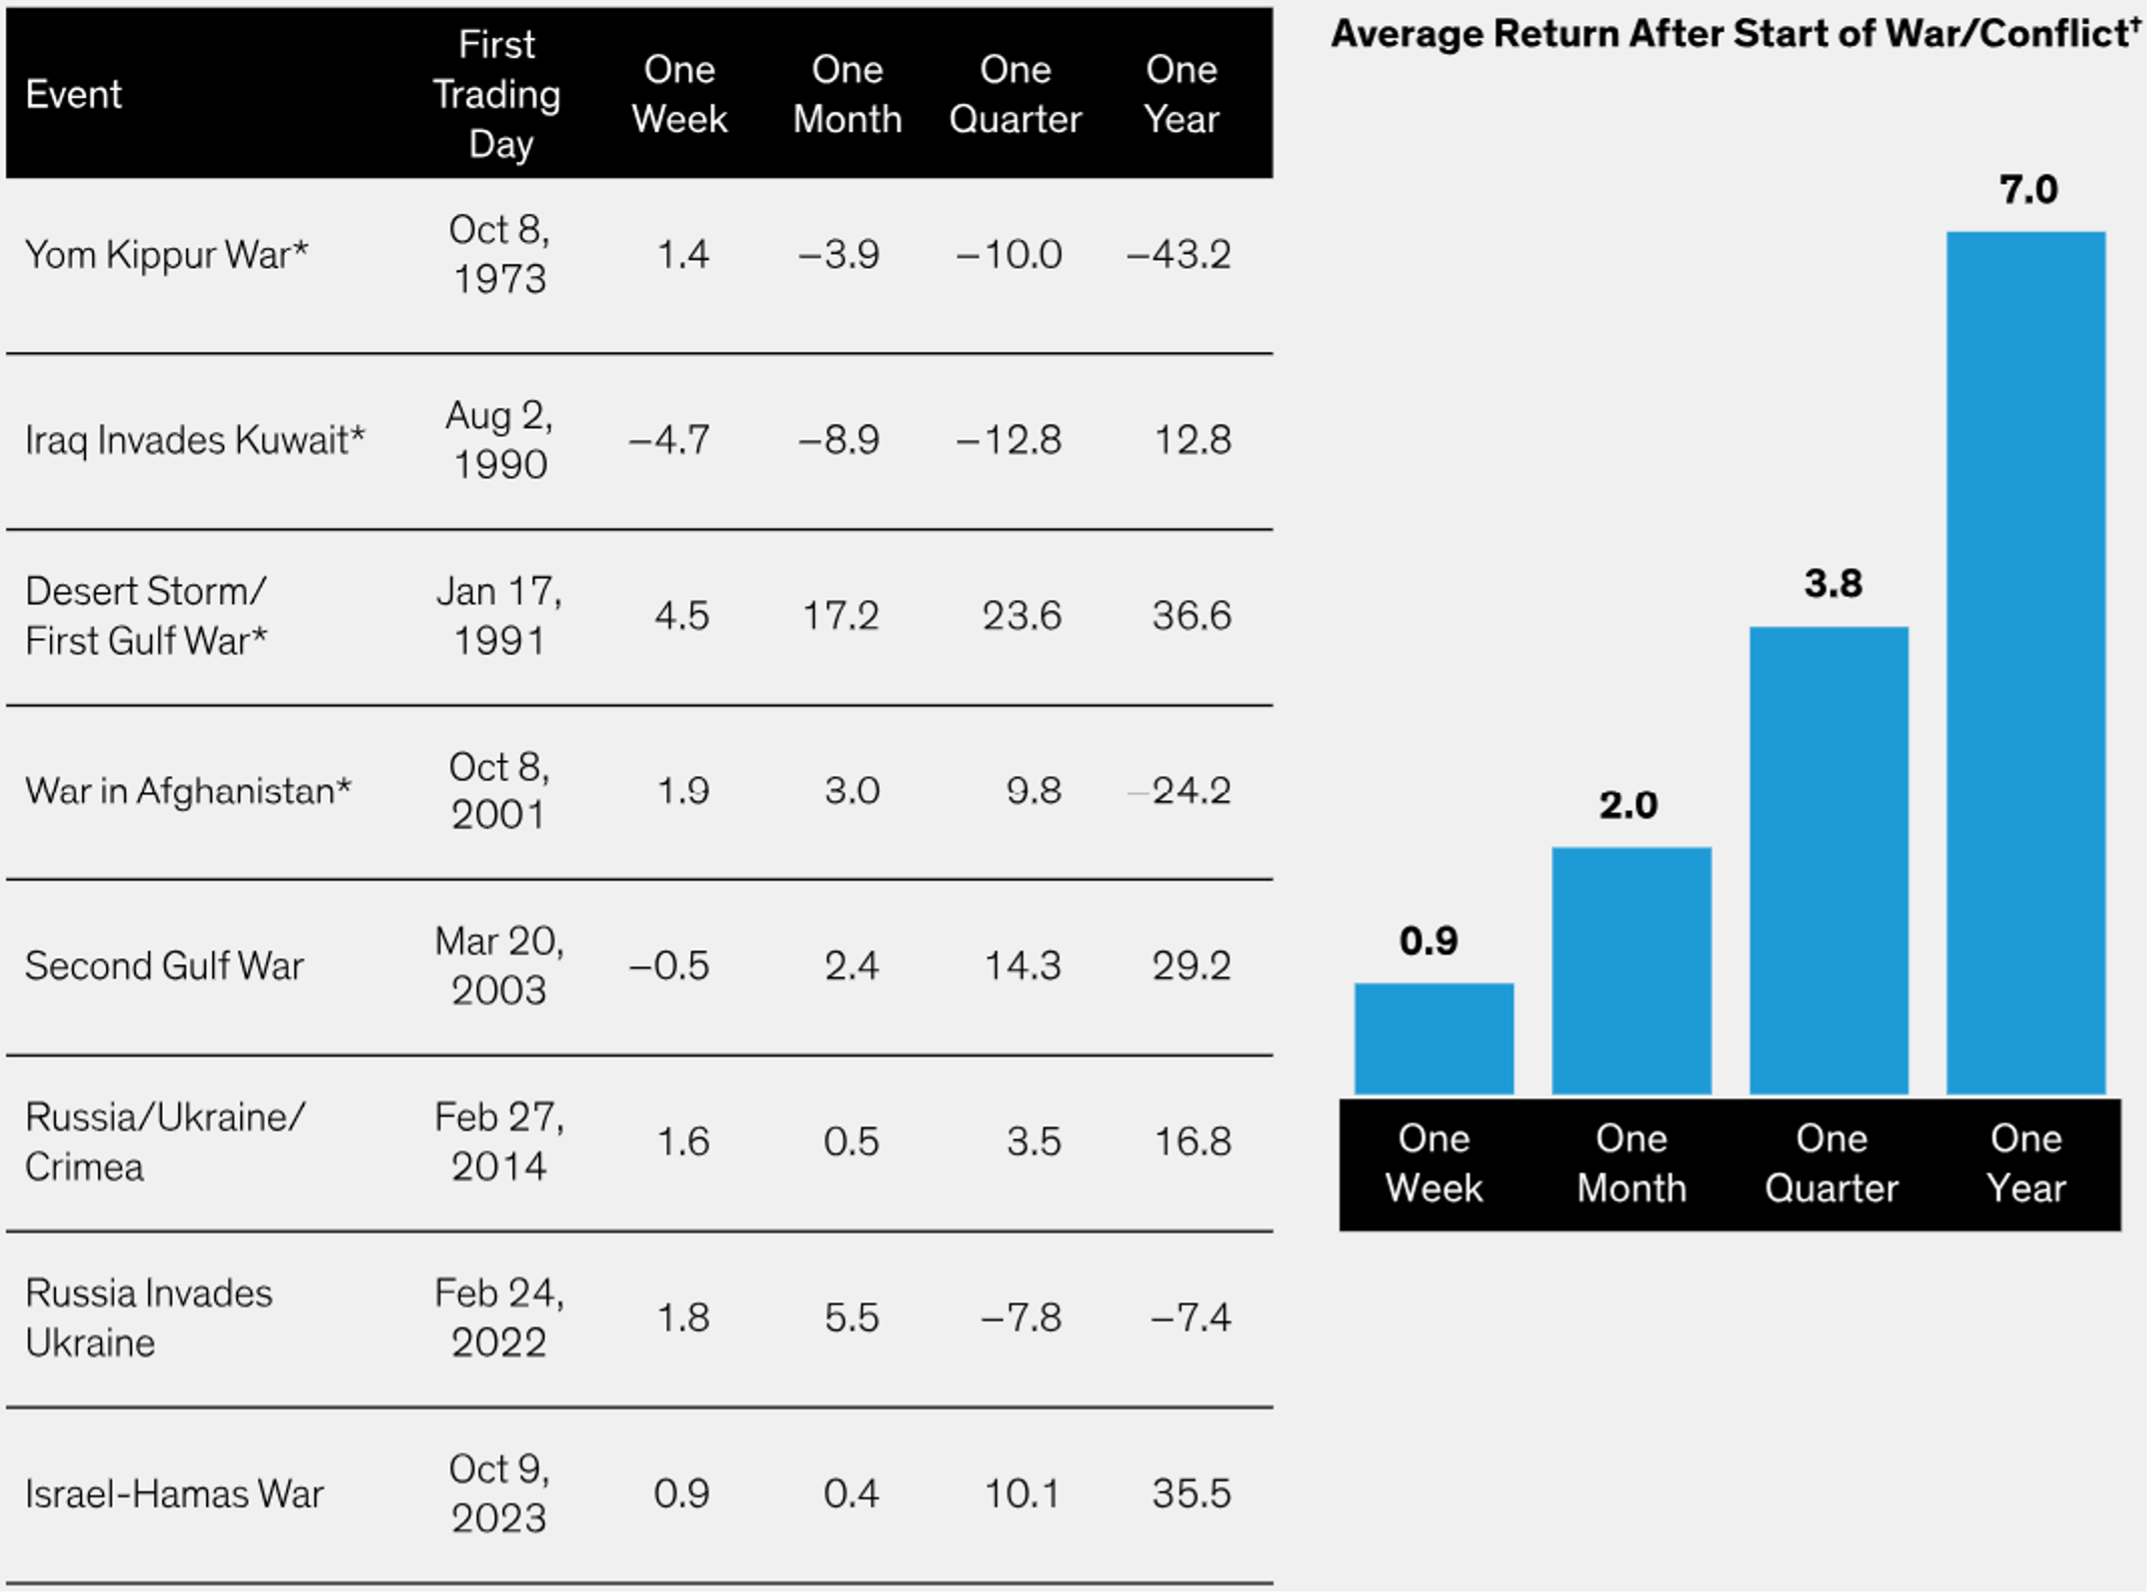
Disclosure: All indexes are unmanaged and cannot be invested in directly. Past performance is no guarantee of future results. Events not labeled include Hungarian uprising ('56), Suez crisis ('56), Gulf of Tonkin Incident ('64), Six-Day War ('67), Yom Kippur War ('73), Israel-Hamas War ('23), U.S.-Israeli Airstrikes of Iran Nuclear Sites ('25). The modern design of the S&P 500 stock index was first launched in 1957. Performance back to 1950 incorporates the performance of the predecessor index, the S&P 90.
AllianceBernstein provides additional perspective, showing that wars over the past 50 years have generally not had a lasting negative impact on equity markets. In fact, the data suggests that the S&P 500 has delivered an average one-year return of approximately 7% following major geopolitical conflicts.
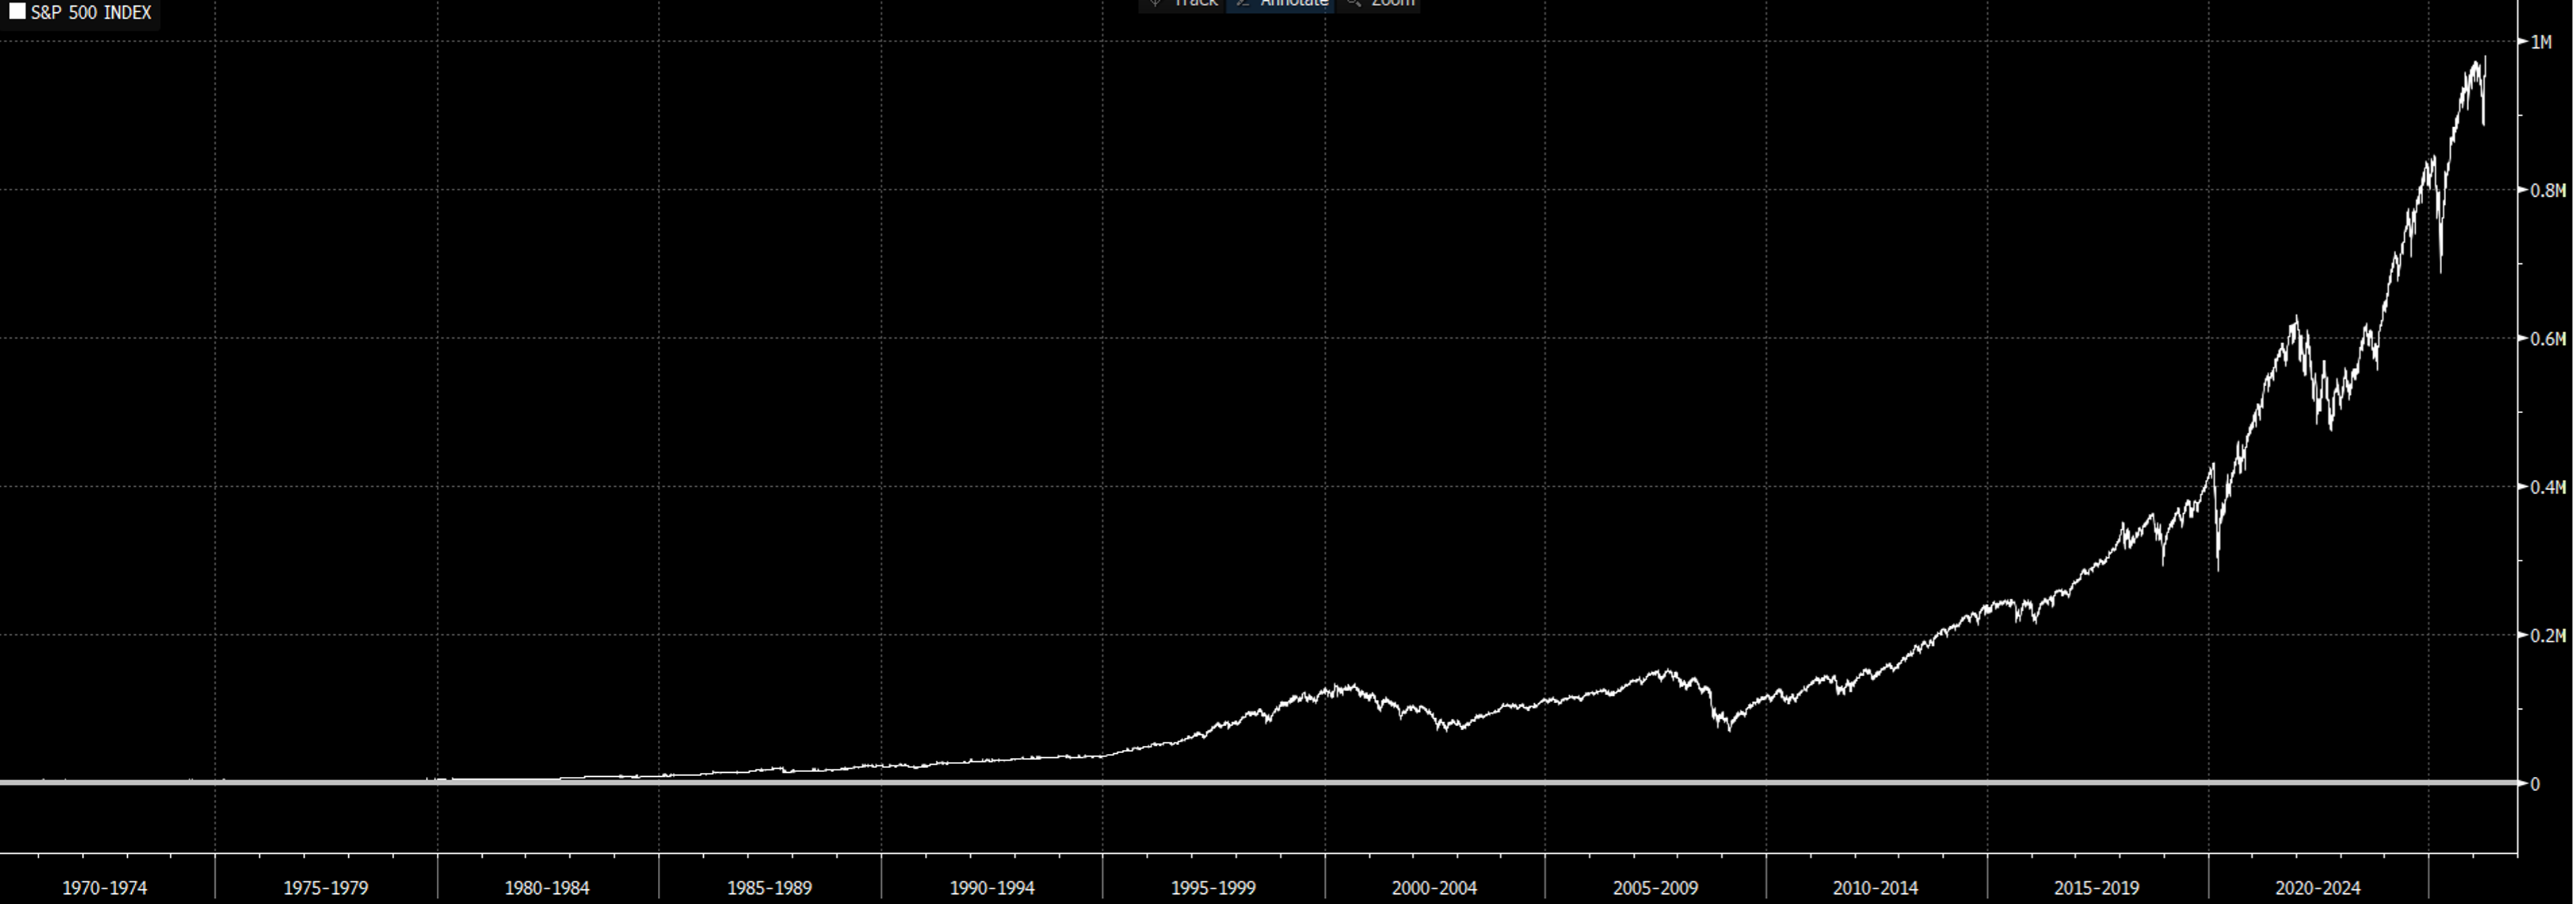
This resilience is consistent with the broader, long-term trajectory of the market. A historical view of the S&P 500 reveals a persistent upward trend punctuated by temporary declines. Notably, these downturns tend to form “higher lows” over time – an encouraging pattern that reflects the market’s ability to grow despite periodic disruptions.
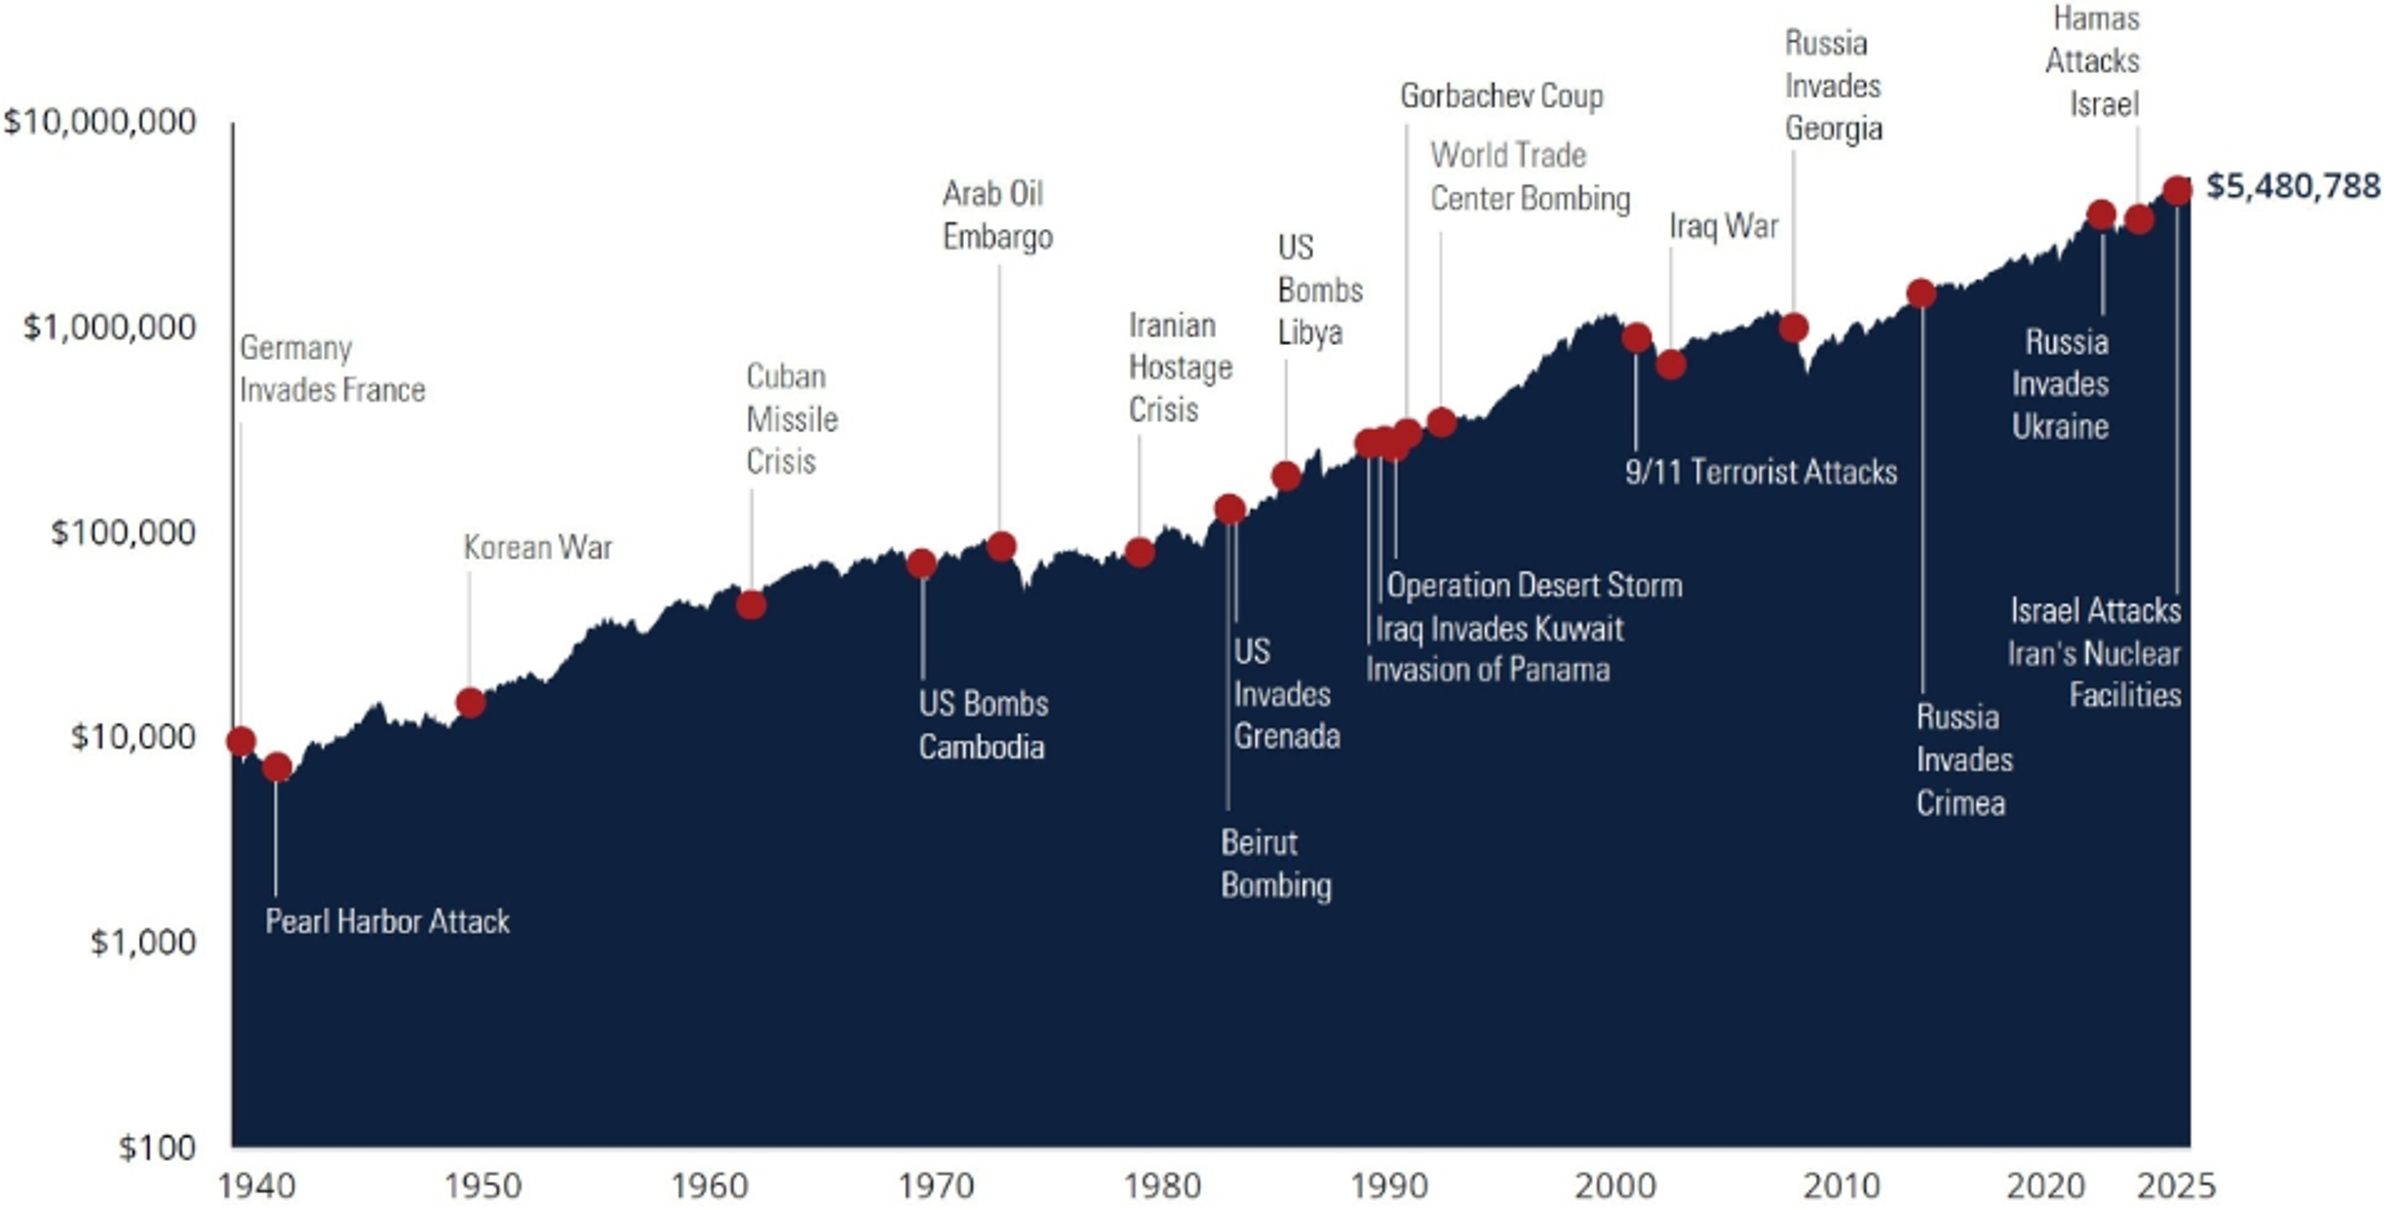
A long-term “growth of $10,000” analysis reinforces this point. Even when accounting for multiple global conflicts and economic downturns – some more severe than others – the market has demonstrated an enduring capacity to recover and advance over time.
Of course, past performance does not guarantee future results. Markets can behave unpredictably, especially in the short term. However, historical patterns offer valuable context for navigating periods of uncertainty.
In times of heightened uncertainty, it is easy to be influenced by fear. However, Scripture reminds us in 2 Timothy 1:7 that “God has not given us a spirit of fear, but of power and love and a sound mind.”
For faith-driven investors, this perspective is especially relevant. Rather than reacting to short-term volatility or fear-driven narratives, we are called to exercise discipline, wisdom, and a long-term mindset. Market fluctuations – particularly those tied to geopolitical events – are often temporary, even when they feel significant in the moment.
Maintaining a steady, long-term investment philosophy allows us to navigate these periods with clarity and confidence. When volatility arises, it can be helpful to remember: this too shall pass. With that perspective, you can maintain confidence in the midst of conflict.
1Historical S&P 500 Index prices are sourced from Yahoo!Finance: (https://finance.yahoo.com/quote/%5EGSPC/history/)
S&P 500 Index: A market-capitalization-weighted index of approximately 500 large U.S. companies across major industries, widely used as a benchmark for the overall U.S. stock market and/or large cap U.S. stock market.
Important Risk Information
Investors cannot invest directly in an index and unmanaged index returns do not reflect any fees, expenses or sales charges.
Inspire, the adviser, provides the index for the Inspire Funds to track. The indexes use software that analyzes publicly available data relating to the primary business activities, products and services, philanthropy, legal activities, policies and practices when assigning Inspire Impact Scores to a company. As the Fund may not fully replicate the Index, it is subject to the risk that investment management strategy may not produce the intended results. Past performance is no guarantee of future results.
There is no guarantee that the Funds will achieve their objective, generate positive returns, or avoid losses. Before investing, carefully consider the funds’ investment objectives, risks, charges and expenses. To obtain a prospectus which contains this and other information, call 877.658.9473, or visit www.inspireetf.com. Read it carefully. The Inspire ETFs are distributed by Foreside Financial Services LLC., Member FINRA. Inspire and Foreside Financial Services LLC are not affiliated. Copyright © 2026 Inspire. All rights reserved.
Before investing, carefully consider the funds’ investment objectives, risks, charges and expenses. To obtain a prospectus which contains this and other information, call 877.658.9473, or visit www.inspireetf.com. Read it carefully before investing.
Securities in the Index or in the Fund’s portfolio may underperform in comparison to the general securities markets or other asset classes. The Fund may focus its investments in securities of a particular industry to the extent the Index does. This may cause the Fund's net asset value to fluctuate more than that of a fund that does not focus in a particular industry. Fluctuations in the value of equity securities held by the Fund will cause the net asset value (“NAV”) of the Fund to fluctuate. The Fund is not actively managed and the Adviser will not sell shares of an equity security due to current or projected underperformance of a security, industry or sector, unless that security is removed from the Index or the selling of shares of that security is otherwise required upon a rebalancing of the Index as addressed in the Index methodology. Tracking error may occur because of imperfect correlation between the Fund’s holdings of portfolio securities and those in the Index. The Fund’s use of a representative sampling approach, if used, could result in its holding a smaller number of securities than are in the Index. To the extent the assets in the Fund are smaller, these risks will be greater.
Investors cannot invest directly in an index and unmanaged index returns do not reflect any fees, expenses or sales charges
The Inspire ETFs are distributed by Foreside Financial Services LLC.