
In today’s market, headlines tend to focus on the biggest and most recognizable companies – the mega-cap giants that dominate indexes like the S&P 500® and capture the lion’s share of investor attention. These are the household names everyone knows.
But beneath the surface, a different story is unfolding. Smaller companies – often overlooked by the mainstream financial media – are quietly presenting what may be one of the most compelling investment opportunities in years. For investors in Inspire ETFs, which maintain a noticeable tilt toward smaller-cap companies versus the broader market (see Figure 1), this potential shift could work strongly in their favor. [Inspire Investing serves as the investment adviser to certain proprietary ETFs and receives management fees from those ETFs, which presents a potential conflict of interest.]

Over the past decade, small-cap stocks have meaningfully trailed their large-cap counterparts. The Russell 2000® Index has posted an annualized return of just 7.9%, compared to 13% for the S&P 500® Index.1 [Past performance is not indicative of future results. Actual outcomes may vary.] This sustained underperformance has driven one of the widest valuation gaps seen in decades.
To understand why this matters, it’s helpful to define two key measures of stock valuation:
Currently, small caps – as measured by the Russell 2000® Index – are trading at forward P/E ratios roughly 30% lower than large caps in the Russell 1000® Index (see Figure 3). This discount is not only below the 10-year average but is also the widest seen since the aftermath of the tech bubble in the early 2000s.2

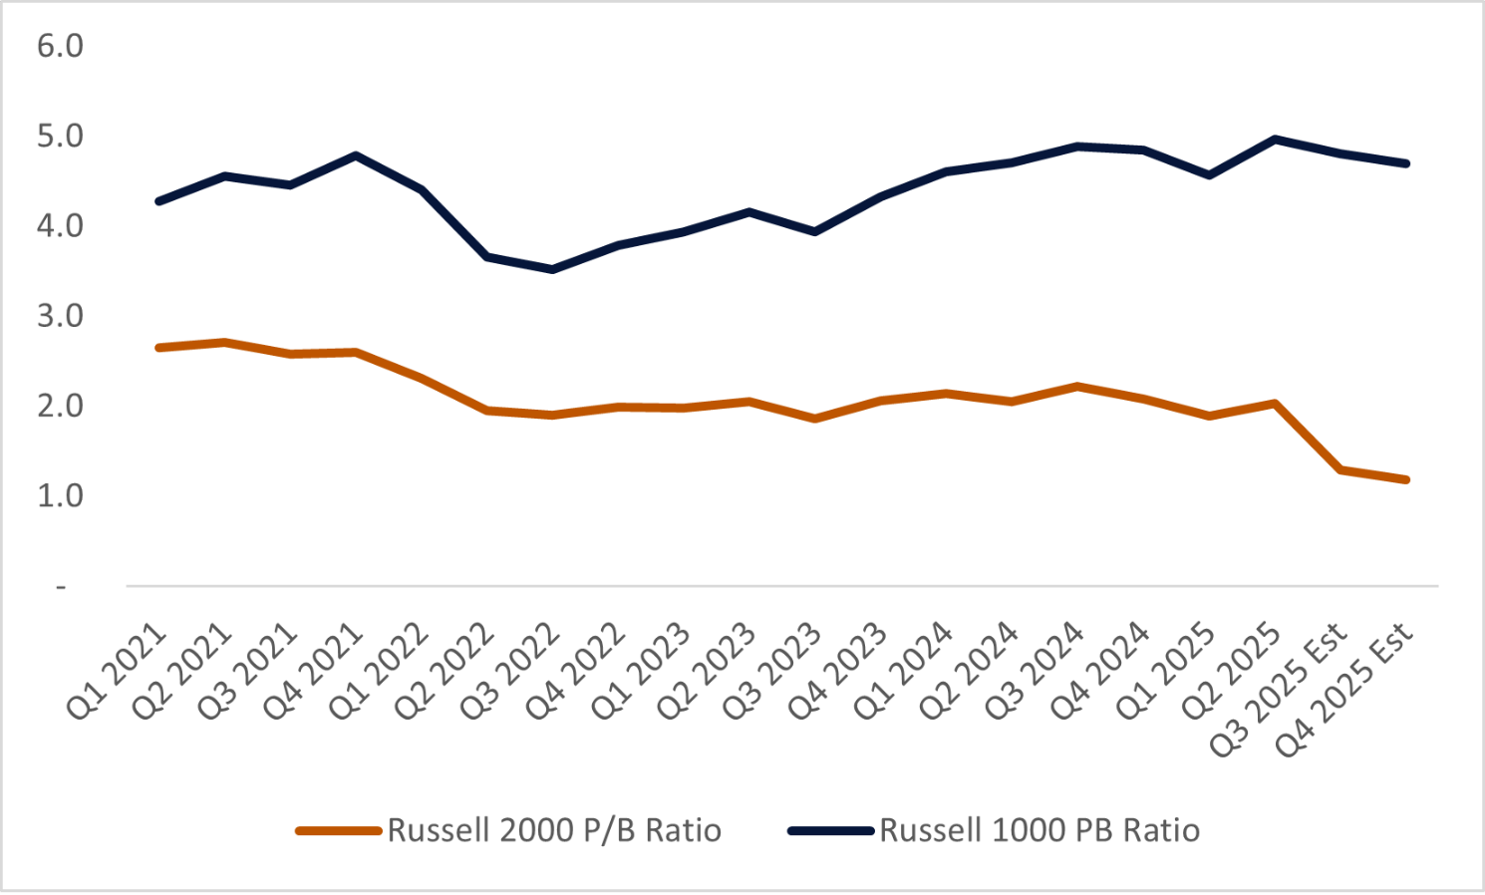
And it’s not just earnings multiples. Small-cap P/B ratios are also well below historical norms relative to large caps, with the gap widening instead of narrowing (Figure 4). This dual undervaluation – in both earnings and asset-based terms – points to a powerful tailwind forming for small caps.
History shows that when small caps trade at unusually steep discounts, they tend to outperform large caps in the years that follow – often by a wide margin.2 [These statements contain forward-looking information and are not guarantees of future performance.] This phenomenon, known as mean reversion, is the market’s tendency to move back toward long-term average relationships after periods of extreme divergence.
Why do small caps often recover so strongly?
Past cycles illustrate this well. After the early 2000s tech bust, small caps outperformed large caps for four straight years by an average of 10% per year. Following the 2008–09 global financial crisis, the Russell 2000® returned more than 97% in just 12 months from the market bottom – beating the Russell 1000® by over 23%.2
Given today’s extreme valuation gap – combined with speculation that parts of the market may be in an “AI bubble” – we may be nearing another inflection point. If history holds true, small caps could be positioned for a significant rebound.
Inspire ETFs’ Biblically Responsible Investing (BRI) screening process often excludes many mega-cap companies whose business practices align with secular values, naturally resulting in a smaller-cap tilt across the portfolios. This positioning means that if the small-cap segment begins to outperform, Inspire ETF investors could benefit disproportionately compared to investors in large-cap-heavy portfolios.
1Source: Charles Schwab “What’s Holding Back Small Caps?” – https://www.schwab.com/learn/story/whats-holding-back-small-caps
2Source: Virtus Investment Partners “Five Reasons to Take Stock of Small Caps” – https://www.virtus.com/assets/files/7n8/five_reasons_to_take_stock_of_small_caps_4834.pdf
Important Risk Information
Investors cannot invest directly in an index and unmanaged index returns do not reflect any fees, expenses or sales charges.
Inspire, the adviser, provides the index for the Inspire Funds to track. The indexes use software that analyzes publicly available data relating to the primary business activities, products and services, philanthropy, legal activities, policies and practices when assigning Inspire Impact Scores to a company. As the Fund may not fully replicate the Index, it is subject to the risk that investment management strategy may not produce the intended results. Past performance is no guarantee of future results.
There is no guarantee that the Funds will achieve their objective, generate positive returns, or avoid losses. Before investing, carefully consider the funds’ investment objectives, risks, charges and expenses. To obtain a prospectus which contains this and other information, call 877.658.9473, or visit www.inspireetf.com. Read it carefully. The Inspire ETFs are distributed by Foreside Financial Services LLC., Member FINRA. Inspire and Foreside Financial Services LLC are not affiliated. Copyright © 2026 Inspire. All rights reserved.


