As we move into the New Year, it is helpful to reflect on how Inspire ETFs performed in 2025 relative to commonly used secular benchmarks. Overall, 2025 was a strong year for Inspire ETFs, demonstrating that investors can remain faithful to their biblical values while still participating meaningfully in market growth.
As illustrated in the chart, Inspire’s lineup delivered competitive – and in several cases superior – results compared to traditional benchmarks.
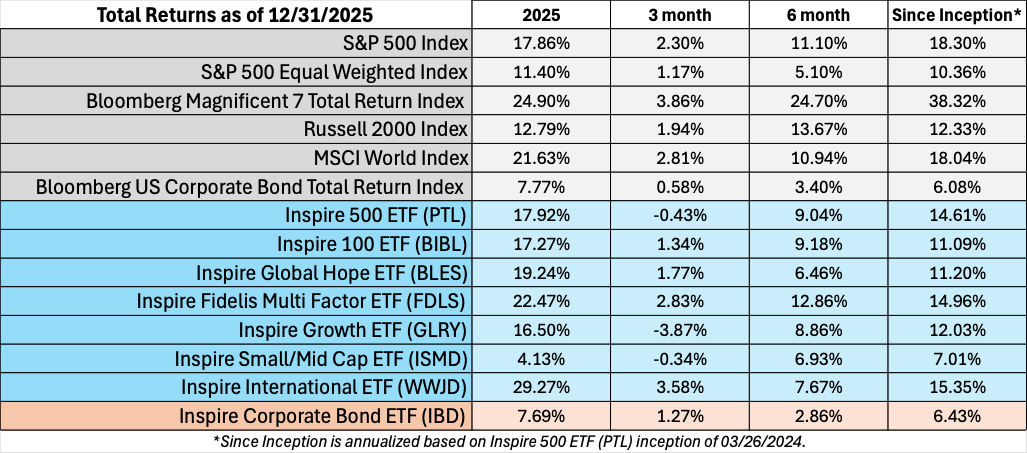
Inspire’s U.S. large-cap ETFs, the Inspire 500 ETF (PTL) and the Inspire 100 ETF (BIBL), closely tracked the performance of the S&P 500, the standard benchmark for U.S. large-cap equities. Notably, PTL slightly outperformed the S&P 500 in 2025, posting a total return of 17.92%. This outcome is particularly noteworthy given PTL’s values-based screening and exclusion of several of the market’s largest and most influential stocks.
The top-performing Inspire ETF in 2025 was the Inspire International ETF (WWJD), which delivered an impressive 29.27% total return – well ahead of the MSCI World Index (21.63%). This strong performance highlights the benefits of diversified international exposure during a year when non-U.S. markets meaningfully contributed to global equity returns.
Similarly, the Inspire Global Hope ETF (BLES) – which combines international exposure similar to WWJD with U.S. large-cap holdings – produced a solid 19.24% total return. Together, these results underscore the strength and diversification benefits of Inspire’s global strategies.
Inspire’s growth-focused ETFs also delivered encouraging results. The Inspire Fidelis Multi Factor ETF (FDLS) posted a strong 22.47% total return, while the Inspire Growth ETF (GLRY) returned 16.50% for the year. These outcomes reflect disciplined exposure to growth factors while maintaining Inspire’s biblically aligned investment framework.
On the fixed income side, the Inspire Corporate Bond ETF (IBD) performed in line with expectations, closely tracking the Bloomberg U.S. Corporate Bond Total Return Index. IBD achieved a 7.69% total return, compared to 7.77% for the benchmark, demonstrating consistent performance while adhering to Inspire’s values-based approach.
The primary performance outlier in 2025 was the Inspire Small/Mid Cap ETF (ISMD), which delivered a more modest total return of 4.13%, compared to the 12.79% return of the Russell 2000 Index. This performance gap can largely be attributed to ISMD’s smaller-cap tilt relative to the Russell 2000 – ISMD has an Average Weighted Market Cap of $2.69 billion in comparison to the $5.21 billion Average Weighted Market Cap of the Russell 2000.1 While the underperformance relative to secular benchmarks is noticeable, it reflects structural differences rather than a breakdown in investment discipline.
Taken together, these results are highly encouraging. They demonstrate that investors were able to pursue biblical alignment in their portfolios without sacrificing performance – and in several cases, achieved meaningful outperformance relative to secular benchmarks.
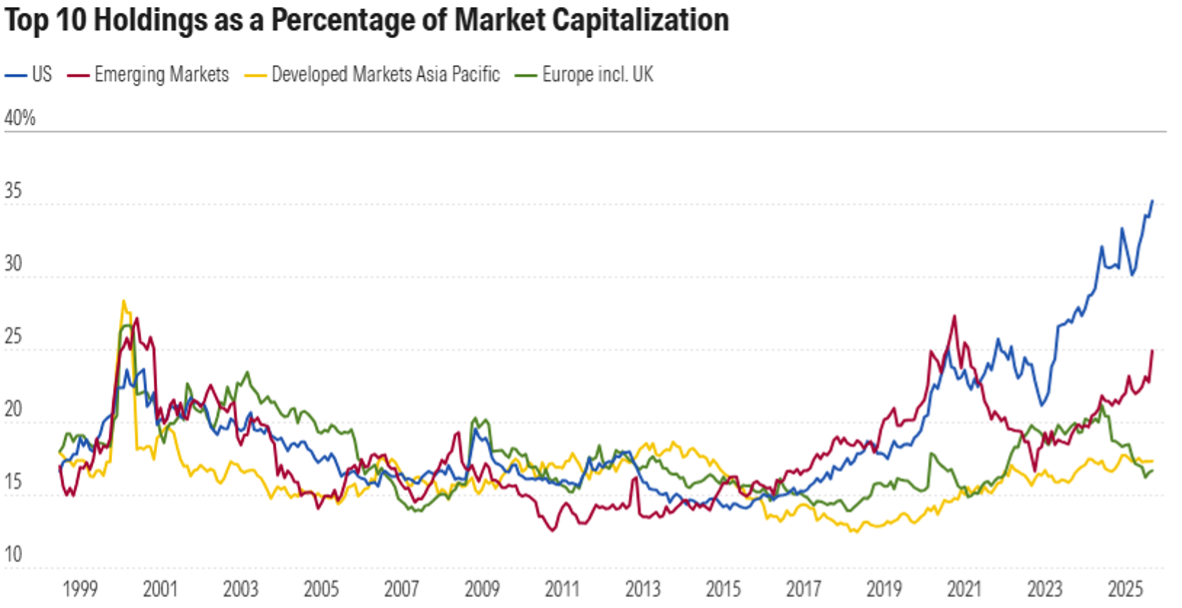
It is also important to consider the outsized role played by the so-called “Magnificent 7” – Alphabet (Google), Amazon, Apple, Meta Platforms (Facebook), Microsoft, Nvidia, and Tesla – in overall market performance. These companies collectively represent roughly one-third of the S&P 5002, making their performance a dominant driver of index-level returns. As shown in the graph below, the top 10 US stocks now account for roughly 35% of the overall market – up from just 18% a decade ago.
The strong gains of these mega-cap giants over the past several years have significantly contributed to the S&P 500’s relative strength, particularly when compared to strategies, like Inspire ETFs, that intentionally exclude these holdings due to lack of alignment with biblical values.
As shown in the performance chart, the S&P 500 has significantly outperformed the S&P 500 Equal Weight Index in recent years, largely due to the concentration and dominance of the Magnificent 7. However, this concentration also introduces meaningful risk. As Morningstar has noted, when a small number of stocks account for a disproportionate share of returns, portfolios tied to broad benchmarks may be less diversified than they appear – creating exposure to a narrow set of business models, sectors, and factor profiles that quietly dominate overall portfolio risk.3
Investors in Inspire ETFs have been able to mitigate this concentration risk relative to many secular portfolios due to Inspire’s exclusion of the Magnificent 7. This same exclusion likely contributed to the outperformance of the Inspire 500 ETF (PTL) in 2025 and positions Inspire ETFs to potentially benefit in the event of a reversal or pullback in the market leadership of these mega-cap stocks.
As we look ahead, Inspire’s disciplined, values-driven approach offers investors both principled alignment and a thoughtfully diversified alternative to increasingly concentrated market benchmarks.
1Average Weighted Market Cap figures sourced from Bloomberg as of 01/27/2026.
2https://finance.yahoo.com/news/magnificent-seven-makes-one-third-140006761.html
3https://www.morningstar.com/financial-advisors/beyond-magnificent-seven-unlocking-value-concentrated-stock-market
Definitions
S&P 500 Index: A market-capitalization-weighted index of approximately 500 large U.S. companies across major industries, widely used as a benchmark for the overall U.S. stock market and/or large cap U.S. stock market.
S&P 500 Equal Weight Index: An alternative version of the S&P 500 in which each of the 500 constituent stocks is given the same weight, providing more balanced exposure across companies regardless of size.
Bloomberg Magnificent 7 Total Return Index: An index that tracks the performance of the seven largest U.S. mega-cap technology-focused companies – often referred to as the “Magnificent 7” – including both price changes and reinvested dividends.
Russell 2000 Index: A market-capitalization-weighted index measuring the performance of approximately 2,000 small-cap U.S. companies, commonly used as a benchmark for the U.S. small-cap equity market.
MSCI World Index: A free-float-adjusted, market-capitalization-weighted index designed to measure equity market performance across developed countries, representing large- and mid-cap companies globally.
Bloomberg U.S. Corporate Bond Total Return Index: An index that measures the performance of investment-grade, U.S. dollar-denominated corporate bonds, including both price changes and interest income through total return calculations.
Important Risk Information
Investors cannot invest directly in an index and unmanaged index returns do not reflect any fees, expenses or sales charges.
Inspire, the adviser, provides the index for the Inspire Funds to track. The indexes use software that analyzes publicly available data relating to the primary business activities, products and services, philanthropy, legal activities, policies and practices when assigning Inspire Impact Scores to a company. As the Fund may not fully replicate the Index, it is subject to the risk that investment management strategy may not produce the intended results. Past performance is no guarantee of future results.
There is no guarantee that the Funds will achieve their objective, generate positive returns, or avoid losses. Before investing, carefully consider the funds’ investment objectives, risks, charges and expenses. To obtain a prospectus which contains this and other information, call 877.658.9473, or visit www.inspireetf.com. Read it carefully. The Inspire ETFs are distributed by Foreside Financial Services LLC., Member FINRA. Inspire and Foreside Financial Services LLC are not affiliated. Copyright © 2026 Inspire. All rights reserved.